
Table of contents
- About Perlego Analytics
- Understand the dashboard
- Access the dashboard
- Filter the data
- Download the data
- Present mode
- Axis and table filters
- Metrics and definitions Glossary
- FAQs
- How regularly is the data in the dashboard updated?
- Why does my chart data not add up to the headline data?
- Are admin users included in the data?
- What's the difference between Active Users and Unique Readers?
- How do the daily, hourly and detailed time buckets work?
- Can I report on COUNTER data?
- Can I access individual user engagement data?
About Perlego Analytics
Use the Perlego Analytics feature to demonstrate return on investment, as well as analyse platform and title usage. It allows you to visualise several data points in different views and slices, empowering you to make informed decisions.
In this guide you’ll learn how to access usage and reading data, filter and export the data as you need or present it in live from the Subscription Manager.
Understand the dashboard
The dashboard is separated into five tabs. The tabs aim to provide a simple and clean experience, with specific focus areas.
- User Adoption: subscription redemptions and active users.
- Book Opens: unique and cumulative book opens.
- Reading Engagement: reading time and unique readers.
- Titles: for a full list of titles opened, including book metadata and usage data.
- Topics: usage data by topic.
- Accessibility: summary of accessibility feature usage.
- Learning tools: summary of learning tools feature usage
(You can check the metrics definition at the bottom of this article).
The dashboard contains a mix of headline data, charts and tables:
- Headline data: the summary data at the top of each tab. It provides the metric totals for the date period selected in the dashboard filters.
- Charts: are used to present time-series data and percentage breakdowns. The dashboard uses a mix of bar, line, area and pie charts.
- Tables: are used to present listed data such as individual titles and topics.
Access the dashboard
The Analytics dashboard can be accessed from the Organisation Subscription Manager. You must have an Admin account to use it.
- In your Perlego account, in the top right navigate to your Profile and select
Organisation Subscription Manager. - On the left sidebar, click on
Analytics.

Filter the data
The main filters are available at the top of the dashboard. These filters apply to all of the data in the dashboard, including every tab.
.png?width=670&height=72&name=Untitled%20(48).png)
Filter by date
-
Choose whether you want a
FixedorRollingdate range (Fixed is the default). The former allows you to pick a specific date reference. The latter allows you to pick a parameter and the data is updated based on current date..png?width=490&height=279&name=Untitled%20(50).png)
-
Next choose the date parameters. For example, selecting the
Betweenparameter for a Fixed date range will allow you to enter a start and end date..png?width=498&height=282&name=Untitled%20(51).png)
- Click
Apply
Filter by tag
Tags are set against users from the Manage Users table. They allow you to group users any way you need, to help with user management and reporting. For example, you might tag users using their course, department or faculty.
You can filter by one or more tags. When you filter by tag, the dashboard will only show data for users with those tags. If you select multiple tags in the filter, users only need to have one of those tags to be included in the data.
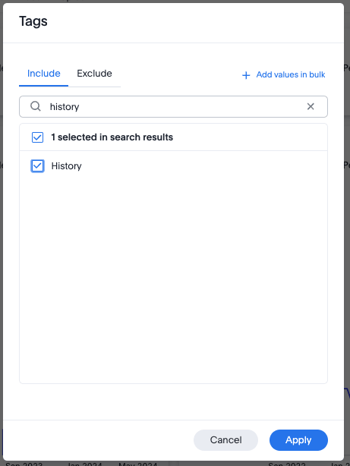
- Click on the
Tagsfilter. - Select the tags you want to include or exclude. You can use the search to make this easier.
- Click
Apply.
Filter by publisher
You can filter by one or more publishers. The publisher filter only applies to the Book Opens, Reading Engagement, Title and Topics tabs. The filter does not apply to the User Adoption tab.
The publisher list will show all publishers on Perlego, not just the publishers you have used.
- Click on the
Publishersfilter. - Select the tags you want to include or exclude. You can use the search to make this easier.
- Click
Apply.

Download the data
You can either download the entire dashboard as PDF or download individual charts or tiles in PNG, XLSX or CSV format.
Dashboard downloads
- In the top right, click on the
three dotsbutton..png?width=670&height=72&name=Untitled%20(52).png)
- Select the
Download PDFoption. - You can choose either the
LiveboardorVisualizationsoption.- The Liveboard will download images of each Analytics tab on an individual page.
- The Visualizations option will download images of each chart or tile on an individual page.
.png?width=407&height=512&name=Untitled%20(53).png)
Chart downloads
You can download data from any chart or tile within the dashboard in PNG, XLSX or CSV format.
- To download the data click on the
three dotsicon to open the chart menu. - Select the
Downloadoption. - Choose the file format (PNG, XLSX or CSV).
.png?width=520&height=410&name=Untitled%20(54).png)
Present mode
Present mode allows you to view the dashboard or a chart in full screen. This is great for expanding the chart size or presenting live in a meeting.
When you present the full dashboard, the data will open up as a full-screen slide show. To do this:
- In the top right, click on the
three dotsmenu..png?width=670&height=72&name=Untitled%20(55).png)
- Select the
Presentoption.
To present an individual chart:
- Find the chart you want to present.
- Click on the
three dotsicon to open the chart menu. - Select the
Presentoption.
Axis and table filters
Time buckets
The bar charts and line charts in the dashboard display time series data. The periods used within the charts are called ‘Time Buckets’. By default the time buckets are set as monthly. You can change the Time Bucket if you want to group the time series data into different periods, such as quarterly.
- To do this click on the
Datelabel on the x-axis (image below). - Hover over the
Time Bucketoption. - Select the Time Bucket you want to view.
.png?width=599&height=404&name=Untitled%20(57).png)
Sorting and filtering
You can also sort bar and line charts in descending or ascending order based on the date, this will normally switch the x-axis ordering. Filtering on a chart axis allow you define date ranges for the chart specifically rather than across the entire dashboard.
On tables the sort option allows you to choose which column the table is sorted by. Where as the filter options allow you to narrow down the results of the table based on any of the columns. .png?width=614&height=284&name=Untitled%20(58).png)
Metrics and definitions glossary
| Metric | Definition | Explanation |
| Active users | Number of users who logged into Perlego. |
Active users is a unique count for the time period or time bucket selected. We count a user as active every time they login to Perlego. If they select the ‘Keep me logged in’ option we will only count them as active if they trigger an event. Events include, but are not limited to, opening a book, highlighting and annotations, creating, opening or editing workspaces, assignments, bookmarking and searching. For the full list of events contact your Account Manager. The first time a user becomes active is when they redeem their account. |
| Annotations | Total number of notes created within a book. |
Users can highlight text within a book and make notes against it. This metric counts every time a note is created. |
| BeeLine Users | Unique users of BeeLine. |
BeeLine is an eye guiding colour gradient that makes it easier to read long blocks of text. It helps users read more effectively with better focus. |
| Bookmarks | Total number of bookmarks created. |
Readers can bookmark throughout a book so they can pick up from where the stopped reading. This metric counts every time a new bookmark is added by one of your users. |
| Bookmark References & Citations | Total number of times the book reference is copied. |
References can be generated in over 50 styles and citation links can be copied. This metric counts every time a user clicks copy against a reference or citation. |
| Book Topics | Perlego categorises books into Topics and Sub-Topics. Topics are broadest categorisation. | Every book is categorised into a Topic. We map our topics to BISAC categorisations that are contained within the books metadata. This means we can attribute reading data to topics such as book opens, unique readers and reading time. |
| Dictionary Searches | Total number of times a word is defined through the Perlego dictionary. |
Readers can either highlight a word and open it in Oxford Learners Dictionary, or they can access the dictionary search from the readers controls. This metric counts ever time a user opens the dictionary. |
| Dyslexic Text Style Used | Total number of times Dyslexic text style has been selected. |
Readers have the option to change the text style to use the OpenDyslexic font. This metric counts the number of times the font has been selected. If the same user switches to the OpenDyslexic font multiple times then it will count each time it is selected. |
| Estimated Value of Books Read | Based on the publisher's digital list price multiplied by the unique number of readers for each book. |
Publishers provide Perlego with their books digital list price (DLP), we multiply this by the Unique Readers for each book. This provides an estimated value of each book if you were to buy a digital copy for every reader, at the digital list price. We describe it as an estimate as we do not have the digital list price for every book. |
| Highlights | Total number of text highlights within a book. |
Users can highlight a section of text from a book. This metric counts every time a highlight is added. |
| Read Aloud (Text to Speech) | Total number of times read aloud has been used. |
Read aloud allows books to be listened to. This metrics counts the number of times your users have played read aloud. |
| Reader Background Colour | Total number of reading sessions with a reader background colour change. |
Users have the choice of four background colours within the reader. This metric counts the number of reading sessions where a user has changed the background colour. |
| Redemptions | Number of users who have successfully signed up to Perlego. | This metric counts the number of users that have signed up to Perlego. It is based on the redemption date (timestamp) of the sign up. |
| Unique Books Opened | Total number of unique books opened. |
This metric counts the number of books that have been opened by one or more users clicking ‘Read’. It does not double count books within a date period or time bucket. If five users open the same book, that counts as one unique book opened. |
| Unique Readers | Total number of unique users who have opened a book. |
This metric counts the number of unique users that have opened a book by clicking ‘Read’. It does not double count users for within a date period or time bucket. For example, if a user reads five books, we only count them once. |
| Text Size Change | Total number of reading sessions with a text size change |
Text size can be controlled from within the reader. This metric counts the number of reading sessions where a user has changed the text size at least once. |
| Total Book Opens | Cumulative number of book opens. |
This metric counts the number of times your users open books by clicking ‘Read’. It is cumulative because we will count the same book multiple times. It counts every time a book is opened regardless of whether it is the same user, opening the same book, as long as the book opens occur on different days. By this we mean, if a user opens the same book multiple times in the same day we only count it as one book open. If they open the same book five days in a row we count it as five book opens. |
| Total Reading Minutes | Total number of minutes users spent reading. |
This metric is the sum total of reading minutes across all users for the time period or time bucket selected. See Total Reading Time (Total Hours read) for an explanation of how we count reading time. |
| Total Reading Time (Total Hours Read) | Total number of hours users spent reading. |
This metric shows the sum total of reading hours across all users for the time period or time bucket selected. We only count the time the user is active, so we start counting reading time when a user opens a book. We do this using a timer that records their reading in five second intervals. We stop recording reading time when the user is out of focus. On web, a user becomes out of focus when they start viewing a different tab or become inactive on Perlego. On mobile, the user is out of focus when the app is moved to the background or the screen is locked. If a user spends less than 5 seconds reading a book no read record is created. |
| Workspaces Created | Total workspaces created |
Workspaces allow users to create reading lists, and save books. This metric counts every time a new workspace is created. |
FAQs
How regularly is the data in the dashboard updated?
We refresh the dashboard on a daily basis, normally around 3am BST/GMT.
As the dashboard is not live, you may notice temporary discrepancies between the subscriptions data displayed in the Manage Users table compared to the data displayed in the Analytics dashboard.
For example, if you revoke a user, this will immediately be reflected in the Manage Users section but it will not be updated in the Analytics dashboard until the next update.
Why does my chart data not add up to the headline data?
In the dashboard there is headline data and chart data. If the dashboard is presenting unique data, such as unique readers or unique book opens, the chart data will not add up to the headline data. This is because the headline data shows the unique count for the entire data period you have selected in the filters. Whereas the chart data shows the unique count for each time bucket in the chart (e.g. monthly).
Lets take an example for Unique Book Opens. If a book is read 100 times in June 2023 it will be counted as one unique book open for that month, then if the same book is opened 200 times in July 2023 it will be counted as one unique book open for that month. This means it will never match the overall Unique Count for the entire time period, as that will only count the unique book open once..png?width=440&height=361&name=Untitled%20(49).png)
Are admin users included in the data?
Yes, Admin users are included within all metrics. Admin users are all of the users within your account that have permission to access the Organisation Subscription Manager.
What's the difference between Active Users and Unique Readers?
Active users is different from Unique Readers because a Unique Reader is only counted if the user logs in and reads a book. Whereas Active Users includes all users that have logged in even if they haven't read a book.
It’s impossible for there to be more Unique Readers than Active Users, however you may find there are less Unique Readers than Active Users. The difference indicates how many users have logged in at least one but never read a book.
How do the daily, hourly and detailed time buckets work?
We collect data on a daily basis, therefore the hourly and detailed time buckets will show the same data as the daily time bucket.
Can I report on COUNTER data?
Yes, Perlego is COUNTER 5.1 compliant. You can download COUNTER reports from the Subscriptions Manager > Analytics
Can I access individual user engagement data?
We do not provide Organisational Admins engagement data against individual users (such as name and email address) within Perlego Analytics. This is to protect the privacy and personal data of users.
If you are on an Ultimate plan, we can provide a secure feed of summarised reading data by user. This is limited to the count of books read for that user on the given date (book count) and the aggregated minutes read across all books by that user on the given date (reading minutes). Please contact your Account Manager to find out more.